To sum up recent activity, U.S. Molds Export Values experienced a steady rise from 2015 to 2017, peaking at $624.2 million, before plateauing and experiencing a minor decline in subsequent years. Conversely, imports demonstrated a more pronounced upward trajectory until 2018, followed by relative stability. This trend contributed to a widening trade deficit, which grew at a compound annual growth rate (CAGR) of 4.1% over the past decade. Domestic mold production exhibited volatility, aligning with economic cycles, while facing threats from increasing imports.
Emerging countries like Thailand, South Korea and India have gained market share in the U.S., presenting challenges and opportunities for mold builders in the U.S. Economic policies addressing issues such as energy security and workforce development are crucial for enhancing U.S. manufacturing competitiveness. Also, optimizing trade with free trade partners, including leveraging existing agreements, offers potential avenues for U.S. moldmakers to explore and capitalize on.
Now, let’s break these trends down.
U.S. Net Importer of Molds for Plastics
Recent data indicates a fluctuating trend in exports and imports over the past few years. However, the U.S. has remained a net importer of molds for plastics. Export values increased from $581.8 million in 2015 to $624.2 million in 2017, marking a steady rise. However, there was a slight dip to $622.0 million in 2018, representing a marginal 0.3% decrease. Since then, exports have remained relatively stagnant, with a decrease of 0.9% observed in 2023.

Recent data shows that while there has been a fluctuating trend in exports and imports over the past few years, the U.S. continues to be a net importer of molds for plastics. This graph compares U.S. mold exports and imports in dollars from 2013 to 2023. Source (All Images) | PLASTICS analysis of U.S. ITC data.
In contrast, imports displayed a steady upward trajectory from $1.6 billion in 2013 to $2.3 billion in 2018. However, after reaching this peak, imports declined slightly to $1.8 billion in 2020. Subsequently, imports have maintained a relatively stable pattern, hovering above the $2.0 billion mark. Like exports, imports experienced a minor decrease of 0.1% last year compared to the previous year.
The trade deficit, resulting from the surplus of imports over exports, has consistently widened over the past decade, with a CAGR of 4.1%. Last year, the deficit amounted to $1.5 billion. In terms of quantity, the deficit witnessed a 10.2% CAGR over the same period.
Volatile Domestic Mold Production: Growth on Pace With Economic Expansion
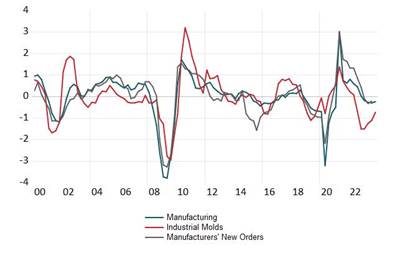
Industrial mold production offers insights into the dynamics of molds for plastics manufacturing in the U.S. According to Plastics Industry Association (PLASTICS) estimates, there has been notable variability in long-term growth rates, exemplified by a 20.4% decrease in 2009 during the Great Recession, followed by an expansion of up to 16.7% postrecession.
Similar growth patterns were observed after the technology bubble in 2001 and the great recession in 2009. Despite a minor dip of 0.3% during the COVID-19 recession, the historical average growth rate of industrial mold production stands at 2.5%, aligning closely with the long-run growth of the U.S. economy measured by gross domestic product (GDP).
From a macro perspective, the trend of mold imports into the U.S. reveals a shift toward countries increasing their share in the U.S. market.
Imports Threaten Domestic Producers’ Market Share
Apart from domestic production fluctuations, competition from imports has added another dimension to the domestic market. As noted previously, since 2013, U.S. imports of molds have grown at a CAGR of 10.2% in units. In 2023, there was a significant decrease of 28.0% in mold imports, while total U.S. imports surged to 68% in 2014. The year 2018 witnessed a 21% decrease, followed by a remarkable 46% increase in the subsequent year. The impact of the COVID-19 pandemic led to a 10% reduction in mold imports in 2020 due to disruptions in international trade.
From a macro perspective, the trend of mold imports into the U.S. reveals a shift toward countries increasing their share in the U.S. market. In 2013, Mexico’s share of U.S. mold imports stood at 7.3%, soaring to 30.2% by 2023. Similarly, Canada’s share nearly doubled from 2.2% in 2013 to 4.7% in 2023. This increase can be attributed to the free trade agreement between Mexico, Canada and the U.S., which facilitated their access to the U.S. molds market, resulting in respective import growth rates of 27.0% and 18.9% from these countries between 2013 and 2023.

A comparison of U.S. mold exports and imports from 2013 to 2023, measured in thousands of units, reveals a notable increase in exports. However, this growth is overshadowed by the significantly larger volume of imports.
In contrast, China, the second largest source of U.S. mold imports, witnessed a decrease in market share from 42.6% in 2013 to 20.9% in 2023, with tepid growth of 2.7% CAGR. The 25.0% tariffs on Chinese-made injection molds are still in place. Total unit imports of molds from China have seen a decline of 30.9% and 59.4% in 2022 and 2023, respectively.
Emerging Countries Gain Market Share
Emerging countries like Thailand, South Korea and India have gained market share over time, with impressive CAGR figures of 45.7%, 23.3% and 15.9%, respectively, in U.S. mold imports. France also saw its share in U.S. mold imports more than triple, reaching 4.0% in 2023 from 1.2% in 2013, with a CAGR of 23.9%.
Looking ahead, it is likely that the U.S. will continue to experience an increase in domestic mold production as other countries gain access to the U.S. market. This could be explained by the advantages of labor and policy that other countries have over the U.S.
Economic Policies Boost U.S. Manufacturing
The recent weakening of the U.S. dollar has adversely impacted the competitiveness of U.S. exports, including molds for plastics, while simultaneously enhancing the affordability of foreign-made goods. Beyond currency exchange rate practices of major U.S. trading partners, there exists a spectrum of economic policies that could bolster the competitiveness of U.S. moldmakers both domestically and internationally — energy security comes top to mind.
A thriving manufacturing sector is contingent upon affordable energy costs. While some countries with flourishing manufacturing sectors are net importers of energy, the rate of change in energy costs is paramount. Stable energy prices facilitate better planning and budgeting for manufacturing firms. Recent data from the U.S. Bureau of Labor Statistics indicates a significant surge in the manufacturing sector’s energy costs, with increases of 24.9% in 2021 and 30.5% in 2022, compared to much lower increases in previous years.
The U.S. Census Bureau’s latest estimates show that energy costs in industrial mold manufacturing increased 10.7% in 2021, following a 6.4% increase in 2020. Ensuring an ample energy supply in the U.S. — which will stabilize energy prices — will support stable energy prices and sustain the manufacturing sector.
Aside from energy, another critical issue deserving of a forward-thinking economic policy is attracting the workforce into manufacturing. The U.S. economy faces a disadvantage in manufacturing due to a shortage of skilled workers in this sector. According to a 2018 report by the Brookings Institute, the U.S. ranks 16th among 18 countries in terms of the percentage of the population employed in manufacturing.1
For example, Poland leads with 20.2% of its population employed in manufacturing, while the U.S. lags at 10.5%. Comparatively, China, Germany and Mexico have higher percentages of their populations employed in manufacturing. Exploring tax incentives for manufacturing workers could help augment labor participation and productivity in manufacturing. One such policy that many economists have considered is making overtime pay tax-free.
Our free trade partnerships with these 20 countries, particularly outside of Mexico and Canada, present opportunities for U.S. moldmakers that certainly warrant attention.
Expanding the manufacturing workforce could lead to increased manufacturing value-added for the economy. Although these comparisons are based on dated information, countries that have increased their share in the U.S. molds for plastics markets typically have high manufacturing value-added as a percentage of GDP. In 2022, Thailand and South Korea had percentages of 27.0% and 26.6%, respectively, while India had 13.3%. Notably, China and Mexico boasted percentages of 27.7% and 21.5%, respectively, compared to the U.S.’ 10.0%. Other countries exhibit higher productivity in manufacturing compared to the U.S.
Relieving U.S. manufacturing from regulatory costs would enhance productivity. One of the key economist arguments against regulatory burden is its tendency to misallocate resources. Businesses may divert financial and human capital away from productive activities toward compliance efforts. According to the National Association of Manufacturers (NAM), federal regulations cost small manufacturers $50,000 per employee per year. Significantly, in 2022, based on NAM’s study, the cost of federal regulations to the U.S. economy exceeded $3.0 trillion, with average compliance costs for a U.S. firm reaching $277,000.
Optimizing trade with free trade partners. Lastly, the U.S. has free trade agreements with 20 countries.2 The U.S. exports to these nations totaled $449.9 million last year, remaining virtually unchanged from the previous year with a slight decrease of 0.6%. However, over the past five years, the value of U.S. mold exports has experienced a decline with a CAGR of 2.8%.
While unit exports surged by 94.6% in 2023, unit exports over the last five years have declined by 1.2%. Our free trade partnerships with these 20 countries, particularly outside of Mexico and Canada, present opportunities for U.S. moldmakers that certainly warrant attention.
References:
1 West, D. and Lansang, C. “Global manufacturing scorecard: How the U.S. compares to 18 other nations.” The Brookings Institution. July 10, 2028. Washington, D.C. https://www.brookings.edu/articles/global-manufacturing-scorecard-how-the-us-compares-to-18-other-nations/#:~:text=Poland%20is%20the%20leading%20country,and%20Japan%20(16.9%20percent.
2 Australia, Bahrain, Canada, Chile, Colombia, Costa Rica, Dominican Republic, El Salvador, Guatemala, Honduras, Israel, Jordan, Korea, Mexico, Morocco, Nicaragua, Oman, Panama, Peru, Singapore.
Related Content
FAQs: What Are the Leadtime Leader Awards?
Here are answers to some frequently asked questions about MoldMaking Technology's annual Leadtime Leader Awards competition.
Read MoreMoldMaking Conference Session Spotlight: Data
Want to learn about digital workflows in mold design or ERP or global mold monitoring and asset management or the impact of tooling digitalization?
Read MoreAMBA Calls Members for Comment Submission During Tariff Review
The imposing of a 25% tariff of molds, tooling and dies imported from China is under review by the U.S. government.
Read MoreMMT Chats: Project Engineer Applies Lean Manufacturing Principles to Growing Sustainability Role
MoldMaking Technology Editorial Director Christina Fuges catches up with MMT’s 30-Under-30 Honoree Katherine Pistorius, who has added Regional Sustainability Coordinator alongside her Project Engineer duties, which demonstrates the many paths one can take in a manufacturing career. Here she shares how this opportunity unfolded for her and what the job entails today and in the future. This episode is brought to you by ISCAR with New Ideas for Machining Intelligently.
Read MoreRead Next
Resilience and Reflections: Moldmaking in the Evolving Economic Landscape
As moldmakers navigate this complex year marked by fluctuating business activities, and approach the upcoming year with cautious optimism, three key considerations should guide their decisions.
Read MoreNavigating Economic Resilience and Consumer Trends
Consumer behavior provides mold builders insight into the evolving market dynamics of goods and services that helps strategic planning.
Read MoreU.S. Economy Indicates Prospects for Moldmakers
An examination of the U.S. economy suggests its resilience against a recession, yet a mixed outlook for moldmaking and plastics persists.
Read More


