Developed by Welles Wilder, the Relative Strength Index (RSI) is a commonly used indicator in technical analysis of various financial securities. The indicator measures how well a security is performing against itself by comparing the strength of its up days versus its down days.
What is the Relative Strength Index?
The Relative Strength Index is a momentum indicator that is used to analyze overbought and oversold conditions when trading financial securities and commodities. The indicator measures the velocity and magnitude of price movements of securities and compares them with the magnitude of average gains and average losses.
The RSI indicator analyzes the last 14 candles and tries to see how many of them are going up and examines how many of them are going down. The indicator also measures the size of each individual indicator.
Being a technical tool, it can be applied to nearly any market, especially liquid and larger markets like forex, stock, and commodities.
RSI is computed using the formula:
RSI = 100 - ( 100 / 1 + RS )
Where RS (Relative Strength) is the average gain divided by the average loss.
The default setting in most trading platforms is 14 day RSI. However, one is free to decide the number of days for computing the indicator. While 14 days is the typical period for displaying RSI on daily charts, to make the indicator sensitive to price changes, one can decrease the number of days included in the calculation. Increasing the number of a period, on the other hand, makes the indicator less sensitive.
The indicator can also be used on other time frames. For instance, if it is used in an hourly chart, a 14 period RSI will base its calculations off the last 14 hours.
The indicator has a range of between 0 and 100. By moving back and forth between 0 and 100, RSI can indicate underlying strength or weakness of stock prices or other securities. Contrary to perception, the Relative Strength Index is far more than a buy and sell signal indicator. The indicator can also be used to gauge the primary direction of a trend.
How Relative Strength Index Works
Given that the RSI oscillates between 0 and 100, the asset is considered overbought when the indicator is above 70 and oversold when the indicator is below 30. While using the indicator, trading signals are typically generated by looking for divergence and failure swings. The indicator is also at times used to identify the general trend of a given asset.
RSI Overbought
Whenever the RSI is above 70 or 80, then the underlying asset that one is tracking is considered overbought. Such levels are associated with strong price movements on the upside, which most of the time are deemed unsustainable, therefore pointing to potential price correction.
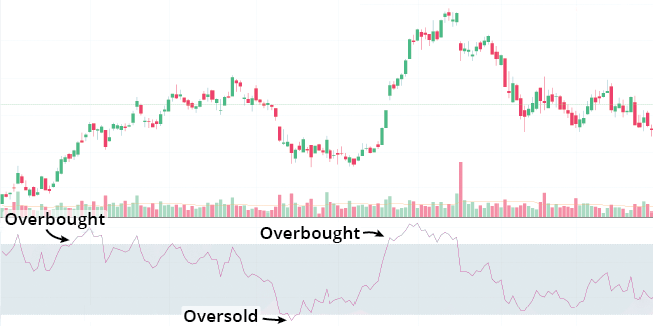
RSI Oversold
When the indicator is below 30, then the price of the underlying asset being tracked is considered oversold. What this means is that the price may have run lower to levels that may not be sustainable for long thus a potential bounce back could be in the offing.
Long traders use the indicator to buy a stock when the price hits the 30 mark so they can gain in the event that it bounces back from a sell-off. The indicator moves higher whenever the average gain over a period (typically 14 days) is larger than the average losses.
Sellers, on the other hand, enter short position whenever the indicator rises to the 70 mark, which is most of the time associated with oversold conditions. The indicator moves lower whenever the average losses are greater than gains.
However, it is not always that obvious, as a security could continue to rise above the 70 mark or continue to fall below the 30 mark. Just because the price is in the overbought or oversold territory does not mean that a reversal will occur. It is important to wait for confirmation with another indicator given that the price can stay in those conditions for a long time.
In a bid to avoid false signals, some traders use more extreme RSI values for buy and sell signals. In this case, one can wait for values above 80 to indicate overbought conditions while values below 20 are interpreted as oversold conditions.
During trends, the RSI tends to remain contained in certain trading levels. For instance, in an uptrend, the indicator would bottom above 30 and top at highs of 80+. During a downtrend, on the other hand, the indicator would top out before it hits the 70 mark and plummets below the 20 mark.
The indicator warns of potential reaction and reversals in the price of a security as the RSI moves in the range of 0 to 100. When the indicator is at 0, it means the price of the asset has dropped in all of the 14 trading days, and when the indicator is at 100, it means the price has risen in all of the 14 trading days.
How to trade stocks using an RSI trading strategy
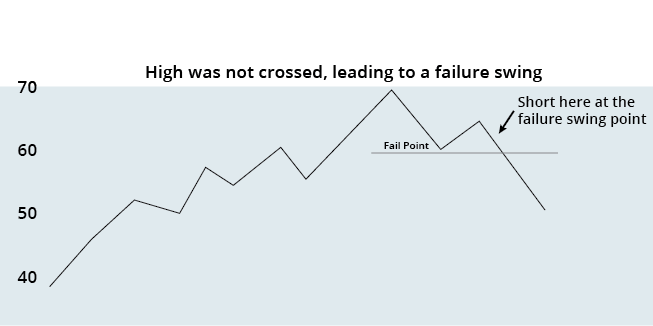
Sell Signal
RSI is commonly used as a leading indicator as it tops and bottoms ahead of the market, which allows traders to take note of an imminent correction in the price of a security.
For instance, the RSI can rise but fail to penetrate the 70 mark and then plummet to the 60 mark. It might try again to rise from the 60 mark but fail to touch the 70 mark on the second attempt. Failure on the second attempt is usually interpreted as a sell signal, telling traders to be ready to enter a sell position as the uptrend is losing momentum.
Buy Signal
Whenever the RSI touches the 30 mark as it rises from the zero mark, it usually indicates that an uptrend is building up and it might be time for traders to watch out for a possible buy. What happens most of the time is that the RSI will rise above the 30 mark and the touch the 40 mark from where it usually experience some selling pressure resulting in a minor correction.
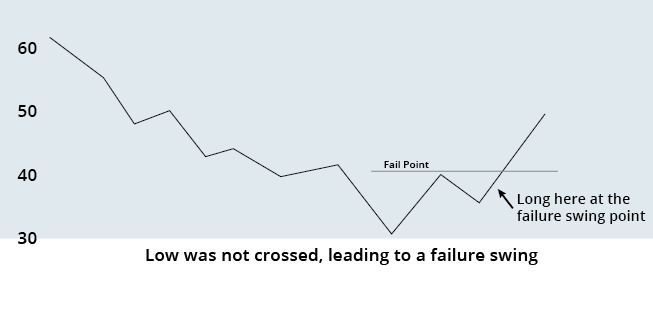
If the upward momentum is stronger than the selling pressure, the RSI would pull back from the 40 mark but won’t touch the 30 mark. Buyers would take advantage of the minor correction to buy on the pullback, thereby resulting in the RSI pushing higher, this time above the 40 mark. The 40 mark would, in this case, be taken as a swing entry point.
Market Correction Signal
In some cases, the price of a security may be moving up while the RSI is moving down, resulting in what is commonly referred to as divergence. Divergence also occurs whenever the price of a security such as stock is moving down while the RSI indicator is moving up.
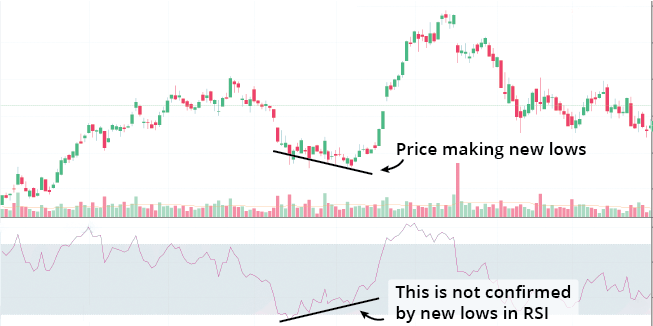
The disparity in the direction of movement should act as a warning sign of a potential market correction. What this means is that, if an asset was trending upwards, chances are very high that it might have hit a potential resistance level from where it is likely to tumble. Consequently, if the asset was trading downwards, upon hitting a strong support level, it is likely to bounce back and start trading upwards. Divergence helps traders know when a trend may almost be over.
Relative Strength Index Limitations
Just like other momentum indicators, the Relative Strength Index also comes with its limitations that are generally offset by using other indicators. One of the main deficiencies associated with the indicator has to do with the fact that the indicator can stay in the overbought or oversold territory for long periods depending on how strong the momentum is.
A price staying in the overbought or oversold territory for long periods could essentially lead to more losses in the event that one entered a short or a buy position immediately after the price rose above the 70 mark or plummeted below the 30 mark.
When it comes to divergence, whenever the RSI is dropping, and the price is rising, it does not mean the price will drop soon as expected. Confirmation of the predicted reversal may have to be confirmed using another indicator, i.e., a MACD (Moving Average Convergence/Divergence oscillator).
RSI ranges can also vary depending on the security that one is trading. For instance, one stock or security may move to the 38 level on pullbacks rather than 30 as is the case with others. Adjustments are thus needed depending on the security one is trading.
What is the difference between RSI and MACD?
Moving Average Convergence/Divergence and Relative Strength Index are the most popular momentum indicators. However, they differ from one another, given that they are designed to measure different things.
While both indicators are considered momentum indicators, MACD tends to measure the relationship between moving averages while RSI pays close attention to recent price highs and lows.
Just as the name implies, MACD measures the convergence and divergence of two moving averages, normally a 12-day Exponential Moving Average and a 26-day Exponential Moving Average (EMA).
MACD is commonly used to gauge the strength of price movement. However, the indicator can also be used to identify overbought and oversold conditions.
Relative Strength Index, on the other hand, is used to gauge whether the price of the asset under consideration is in overbought or oversold territories.
Because the two indicators measure different factors in relation to a security under consideration, they sometimes tend to offer contradicting indications. For starters, an RSI indicator may show that a price of a stock is in overbought territory above the 70 mark, which most of the time would hint at a potential price reversal. However, the MACD at the same time could indicate that the market is under a strong buying momentum even though the price is in overbought territory.
Contrary indications between the two momentum indicators affirm the saying that there is no golden indicator when it comes to technical analysis. It is thus essential to scrutinize various indicators and chart patterns, prior to making decisions on buying and selling positions as well as on exit strategies. Because MACD and RSI can often be contradictory, many traders watch for and act on instances when the two indicators are in agreement.
Conclusion
Relative Strength Index remains a popular momentum indicator because of its multiple uses. The indicator can be used to choose entry and exit positions based on overbought and oversold readings. One can also use the indicator to spot potential price reversals based on divergence.
However, it is important not to rely solely on oversold and overbought indicators when it comes to decisions. Even though they are important points for entering the market in case of retracements, they can be counterproductive when it comes to strong trending environments. RSI being a momentum indicator means extended trends can keep the RSI index in overbought or oversold conditions for long periods.
Taking into consideration its limitations, RSI tends to be an ideal indicator for short-term trading given its versatility for analyzing price highs and lows. While using RSI to identify potential reversals, it is important to incorporate other tools to confirm entry and exit positions. In this case, candlestick analysis and trend line analysis may have to come into play.
Before you make your next trade, you'll want to hear this.
MarketBeat keeps track of Wall Street's top-rated and best performing research analysts and the stocks they recommend to their clients on a daily basis.
They believe these five stocks are the five best companies for investors to buy now...